
| Resource | Science Task | Useful Data |
|---|---|---|
| Toy car + ramp | Test motion and surfaces | Distance, time, average |
| Building blocks | Test structures | Span, height, maximum load |
| Gears | Compare rotation | Teeth, turns, direction |
| Magnets | Test materials and distance | Material, gap, attraction |
| Circuit kit | Build and troubleshoot circuits | Connection, response, resistance |
| Microscope | Compare structures | Shape, texture, visible features |
| Seeds and plants | Track growth | Height, leaves, color, days |
| Weather tools | Track local weather | Temperature, rain, wind |
| Rocks and minerals | Classify specimens | Luster, hardness, texture, magnetism |
| Robot | Test movement accuracy | Target, actual distance, error |
The work children do in these activities is also familiar in formal science education: asking questions, planning tests, using models, working with data, explaining results, and improving designs.[1]
Ramp Height Test
You only need one toy car, one board or stiff piece of cardboard, books, masking tape, and a measuring tape.
Mark one starting point so the car is released from the same place each time. Set the ramp at:
- 10 cm;
- 20 cm;
- 30 cm.
Let the car roll without giving it a push. Measure from the bottom of the ramp to where the car stops, then repeat each height three times.
Illustrative example data:
| Ramp Height | Trial 1 | Trial 2 | Trial 3 | Average |
|---|---|---|---|---|
| 10 cm | 72 cm | 75 cm | 74 cm | 73.7 cm |
| 20 cm | 108 cm | 112 cm | 110 cm | 110.0 cm |
| 30 cm | 146 cm | 151 cm | 148 cm | 148.3 cm |
These numbers are examples only. A different car, wheel design, ramp, floor, or release method can give very different results.
Use the table rather than guessing from memory. Ask the child:
- Which ramp height gave the longest average distance?
- How much farther did the 30 cm setup travel than the 10 cm setup?
- Which set of three trials was most consistent?
- What part of the setup could cause an unusually long or short trial?
Older learners can also time the car from the bottom of the ramp to the stopping point.
Average speed = distance traveled ÷ elapsed time
If the car travels 1.10 m in 2.4 seconds:
1.10 ÷ 2.4 = about 0.46 m/s
That number is the average speed during the part of the trip you measured. It is not the car’s exact speed at the bottom of the ramp.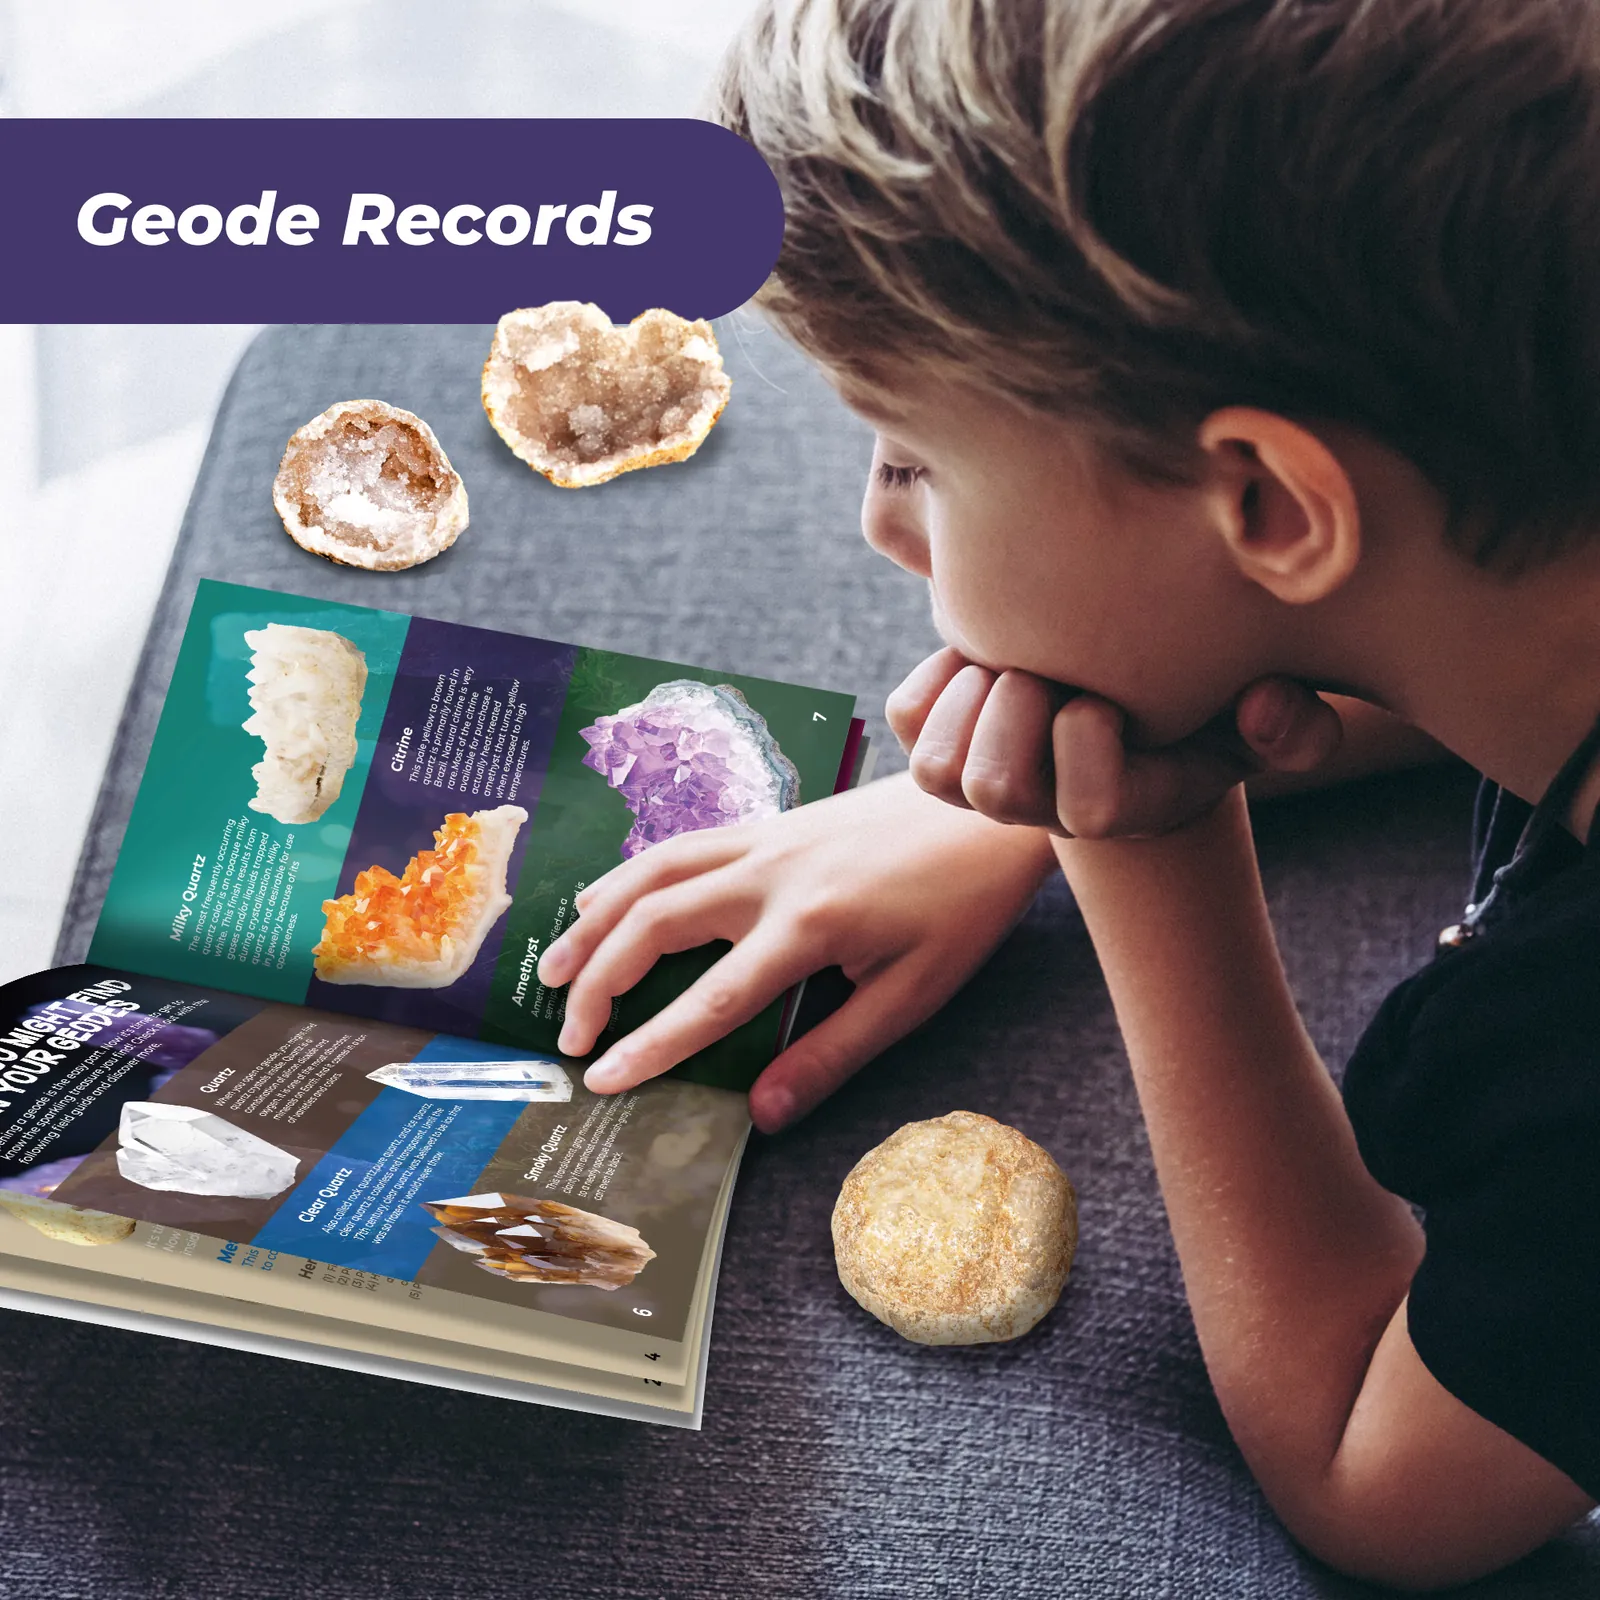
Surface Friction Test
Keep the car, ramp height, starting position, and release method unchanged. Swap only the surface after the ramp.
Use:
- smooth floor;
- cardboard;
- cotton towel;
- carpet.
Illustrative example data:
| Surface | Trial 1 | Trial 2 | Trial 3 | Average |
|---|---|---|---|---|
| Smooth floor | 143 cm | 140 cm | 142 cm | 141.7 cm |
| Cardboard | 116 cm | 121 cm | 118 cm | 118.3 cm |
| Towel | 78 cm | 74 cm | 76 cm | 76.0 cm |
| Carpet | 55 cm | 52 cm | 54 cm | 53.7 cm |
The useful result here is the measured stopping distance, not a rule such as “rougher always means more friction.” A soft carpet can affect the wheels differently from a hard rough surface. Wheel shape, surface deformation, and rolling resistance all matter.
A child can write: “In this test, the car traveled the shortest average distance on carpet and the longest distance on the smooth floor.”
Bridge Load Test
With blocks or another reusable construction set, give the child a target instead of simply asking for a bridge. Building STEM toys are more useful for engineering practice when children can change the design instead of copying one finished model.
Use these limits:
- bridge span: 30 cm;
- maximum pieces: 40;
- minimum target load: 1,000 g;
- bridge must stand without being held.
Add weight slowly, and stop before the bridge becomes unsafe or falling pieces can cause a problem.
Illustrative example:
| Design | Maximum Load | What Changed |
|---|---|---|
| Design 1 | 850 g | Straight side supports |
| Design 2 | 1,250 g | Triangular side bracing added |
The second design supports 400 g more.
Percentage increase = 400 ÷ 850 × 100 = about 47%
Do not stop at “Design 2 is better.” Look at where Design 1 failed:
- deck bent;
- joint separated;
- support moved sideways;
- bridge twisted;
- base moved.
That failure point tells the child what to change before the next test.
Tower Balance Test
Build one tower with a wide base and another with a narrow base. Try to keep the height and top platform similar.
Place the same 100 g weight on top and move it farther from the center each time.
Illustrative example record:
| Weight Position | Wide-Base Tower | Narrow-Base Tower |
|---|---|---|
| 2 cm from center | Stable | Stable |
| 4 cm from center | Stable | Leans slightly |
| 6 cm from center | Stable | Tips |
| 8 cm from center | Tips | — |
The exact tipping point will depend on the tower you build. The useful number is the real distance measured in your own test, not the example result above.
Gear Ratio Test
Use two gears with known tooth counts and mark one tooth on each gear with removable tape.
When a 40-tooth gear directly drives a 20-tooth gear, the smaller gear turns twice for every full turn of the larger one.
| 40-Tooth Gear | 20-Tooth Gear |
|---|---|
| 1 turn | 2 turns |
| 2 turns | 4 turns |
| 3 turns | 6 turns |
The two external gears rotate in opposite directions.
Now let the 20-tooth gear drive the 40-tooth gear and count again. After that, add a third gear and record:
- which direction the first gear turns;
- which direction the second gear turns;
- which direction the third gear turns.
The same construction set can also be used for a pulley or wheel-and-axle task, such as lifting a 200 g load or moving it across a table.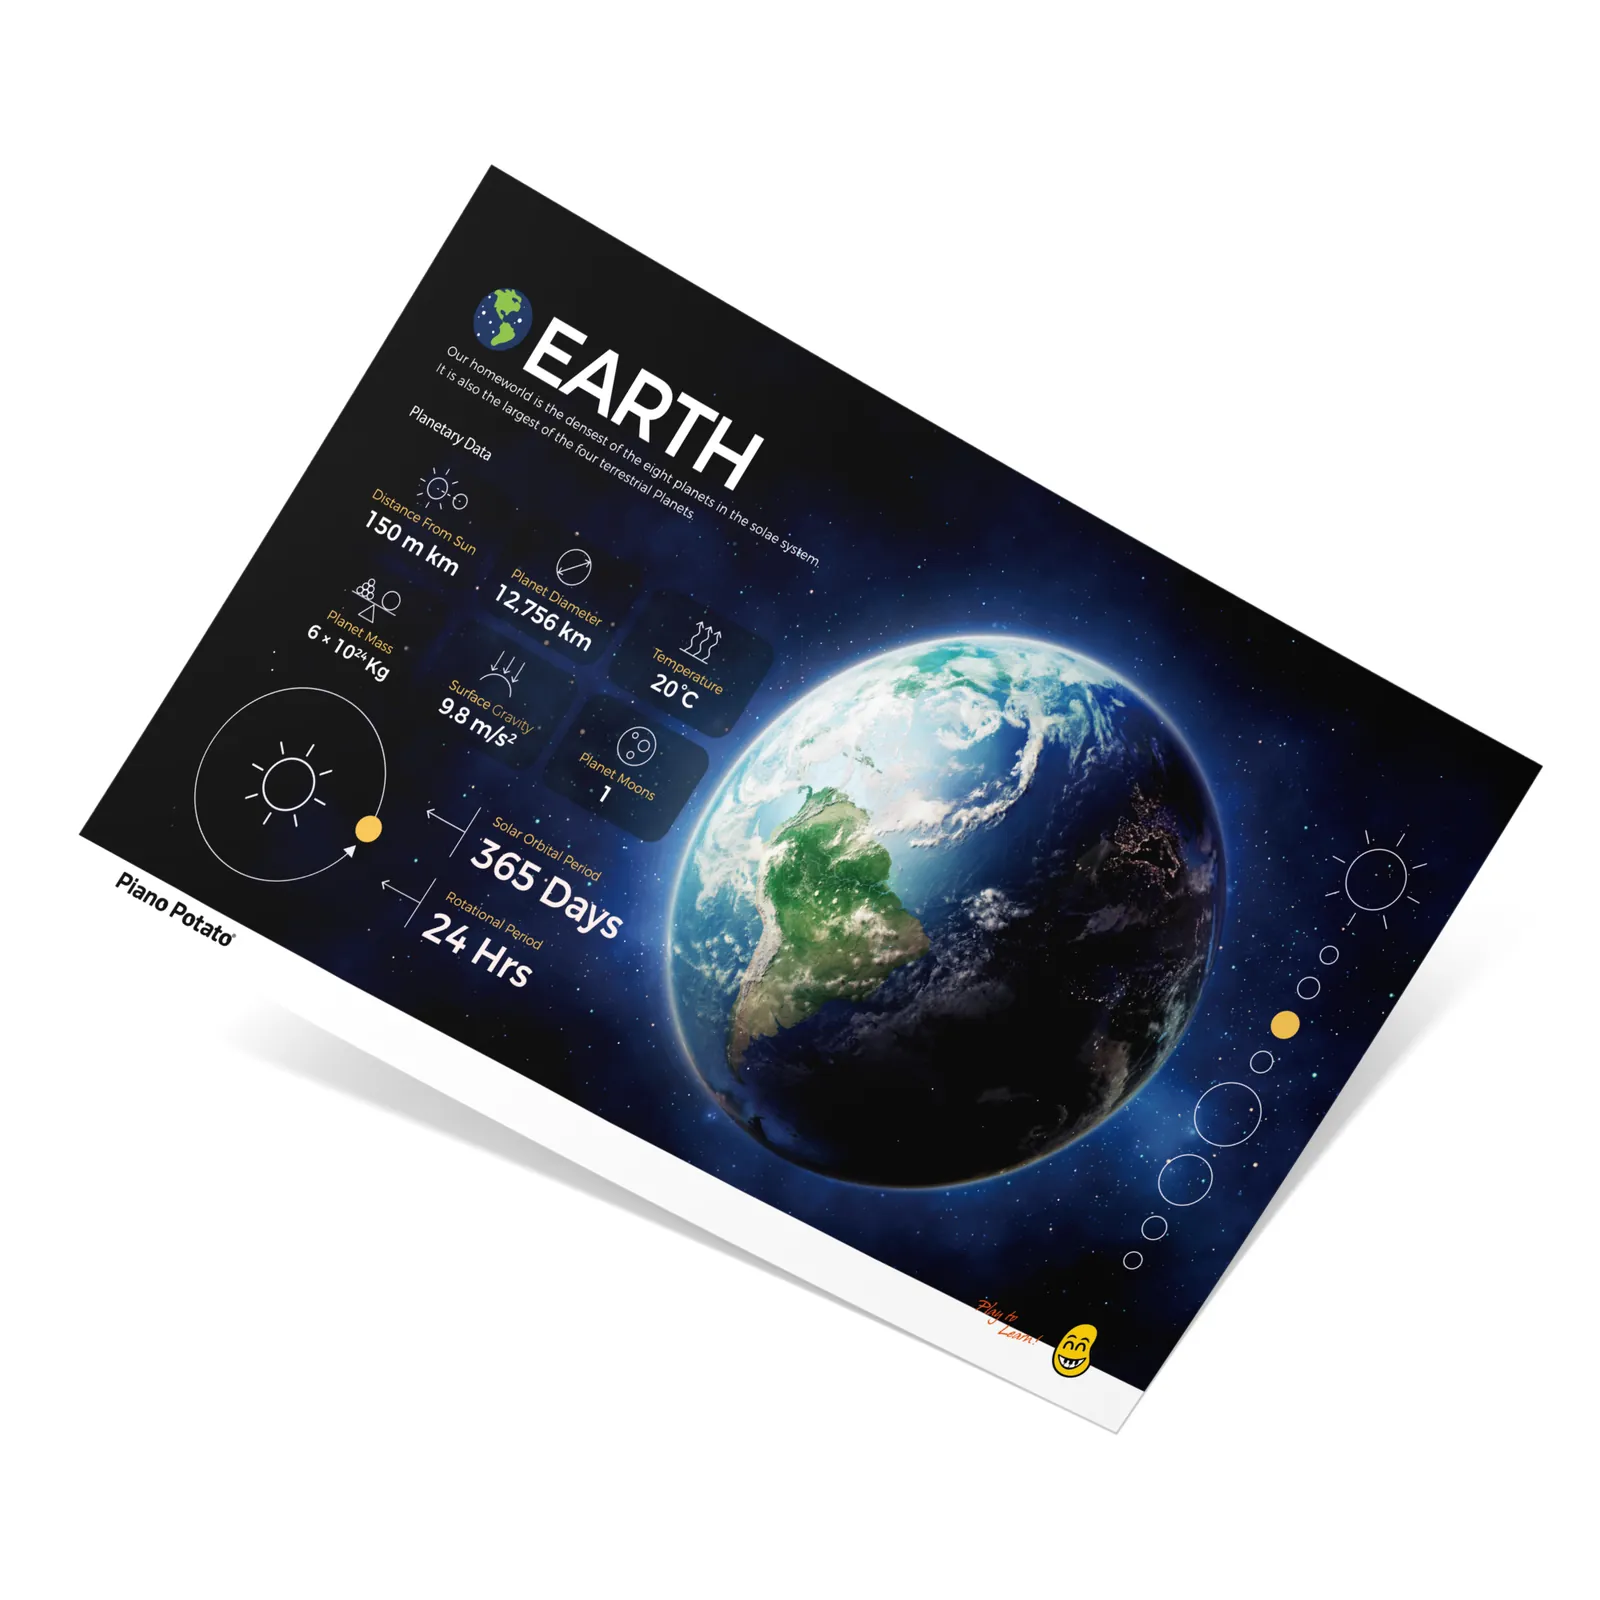
Magnet Material Test
Choose an age-appropriate magnet and objects made from known materials.
| Object | Prediction | Observed Attraction |
|---|---|---|
| Steel paper clip | ||
| Steel screw | ||
| Aluminum foil | ||
| Copper wire | ||
| Wood | ||
| Plastic |
Steel often shows strong attraction to an ordinary classroom magnet. Aluminum and copper do not show the same strong attraction.
Coins are less useful unless you know exactly which one you are testing. Their metal composition can change by country and year, so write down the exact coin rather than simply recording “coin.”
Magnet Distance Test
Use the same magnet and paper clip throughout the test. Add equal layers of card between them.
Illustrative example:
| Card Layers | Clip Lifted? |
|---|---|
| 0 | Yes |
| 2 | Yes |
| 4 | Yes |
| 6 | Sometimes |
| 8 | No |
The layers are mainly increasing the distance between the magnet and the clip. Saying that the card “blocks magnetism” would give the child the wrong idea about what changed in the test.
Basic Circuit Test
Use the low-voltage battery holder and electrical parts supplied or approved for the educational kit.
Build a circuit with:
- battery holder;
- wires;
- bulb or LED;
- switch, if available.
Once the light works, ask the child to trace the path from one battery terminal, through the components, and back to the other terminal.
Then remove one connection.
| Setup | Complete Path? | Light Response |
|---|---|---|
| All connections closed | Yes | On |
| One wire removed | No | Off |
| Switch open | No | Off |
| Switch closed | Yes | On |
LED direction can matter because LEDs have polarity. A bare LED also needs suitable current limiting. Keep to the resistor, LED module, battery, and wiring described by the kit. If an LED does not light, increasing the voltage is not the right fix.
Graphite Resistance Test
Draw two dark graphite paths with a pencil:
- one short path;
- one longer path.
Keep the width and darkness as similar as possible so length is the main difference.
Graphite can carry current, but it also has resistance. That means a long or thin pencil line may produce a dim LED or no obvious visible light.
The American Physical Society uses pencil graphite in a classroom activity to show that changing the length and amount of graphite changes electrical resistance.[2]
| Graphite Path | Example Observation |
|---|---|
| Short, thick line | LED brighter |
| Long, thick line | LED dimmer |
| Long, thin line | Very dim or no visible light |
Record what the circuit actually does. LED brightness is only a rough comparison unless you use a proper measuring instrument.
Microscope Comparison
Familiar materials are easier to start with than unfamiliar prepared slides.
| Sample | Record |
|---|---|
| Thread | Fiber shape, color, loose strands |
| Paper | Fiber pattern and surface |
| Salt | Crystal shape and edges |
| Sugar | Crystal shape and edges |
| Leaf | Surface pattern and visible structures |
| Prepared onion epidermis | Visible plant-cell pattern |
Start at the lowest magnification and center the specimen before moving higher.
Look at the same sample in three ways:
- unaided eye;
- magnifying glass;
- microscope.
Be precise about what is visible. Paper and cloth show fibers. Salt shows crystals. A properly prepared onion epidermis can show plant cells. Not everything seen through a microscope is a cell.
Plant Growth Test
Use the same seed type, soil, container size, planting depth, and water amount for both groups. Change one light condition.
Illustrative example data:
| Day | Group A Height | Group B Height |
|---|---|---|
| 1 | 1.1 cm | 1.1 cm |
| 3 | 3.3 cm | 3.8 cm |
| 5 | 5.9 cm | 7.1 cm |
| 7 | 8.2 cm | 10.6 cm |
| 10 | 11.4 cm | 15.2 cm |
Height is only one part of the record. Add:
- leaf count;
- leaf color;
- stem thickness or strength;
- direction of growth.
A 15.2 cm plant with two pale leaves and a weak stem may be in poorer condition than an 11.4 cm plant with four green leaves and a stronger stem.
Plants grown with too little light can become long, pale, and weak, a type of growth known as etiolation.[3]
Older learners can compare 4, 8, and 12 hours of light while keeping the same lamp and lamp-to-plant distance.
Seven-Day Weather Log
Use an outdoor thermometer, rain gauge, notebook, and clock. Take the reading in the same place and at approximately the same time each day.
Keep the thermometer out of direct sunlight but exposed to circulating outdoor air. NOAA recommends shielding an air-temperature thermometer from direct sun.[4]
Illustrative seven-day record:
| Day | Afternoon Temperature | Rainfall |
|---|---|---|
| 1 | 17°C | 0 mm |
| 2 | 19°C | 0 mm |
| 3 | 20°C | 0 mm |
| 4 | 16°C | 4 mm |
| 5 | 15°C | 7 mm |
| 6 | 21°C | 0 mm |
| 7 | 22°C | 0 mm |
Using those example readings:
- highest temperature = 22°C;
- lowest temperature = 15°C;
- temperature range = 7°C;
- average afternoon temperature = about 18.6°C;
- rainy days = 2 of 7;
- total rainfall = 11 mm.
A longer weather unit can sit alongside geology, erosion, fossils, and space activities instead of treating weather as a one-off experiment.
Erosion Runoff Test
Fill two shallow trays with similar amounts of the same soil. Leave one mostly bare. Add grass, roots, leaves, or another simple ground-cover model to the second.
Keep the slope the same. Pour 500 mL of water onto each tray from the same height and at roughly the same rate.
Illustrative example:
| Tray | Water Added | Runoff Collected | Observation |
|---|---|---|---|
| Bare soil | 500 mL | 340 mL | Cloudy water and visible soil movement |
| Covered soil | 500 mL | 230 mL | Less cloudy water and less visible soil movement |
The result will change with soil type, packing, slope, cover, and water flow, so use the numbers above only as an example of how to record the test.
Earth and space science materials can also connect this work with rocks, minerals, fossils, and landforms.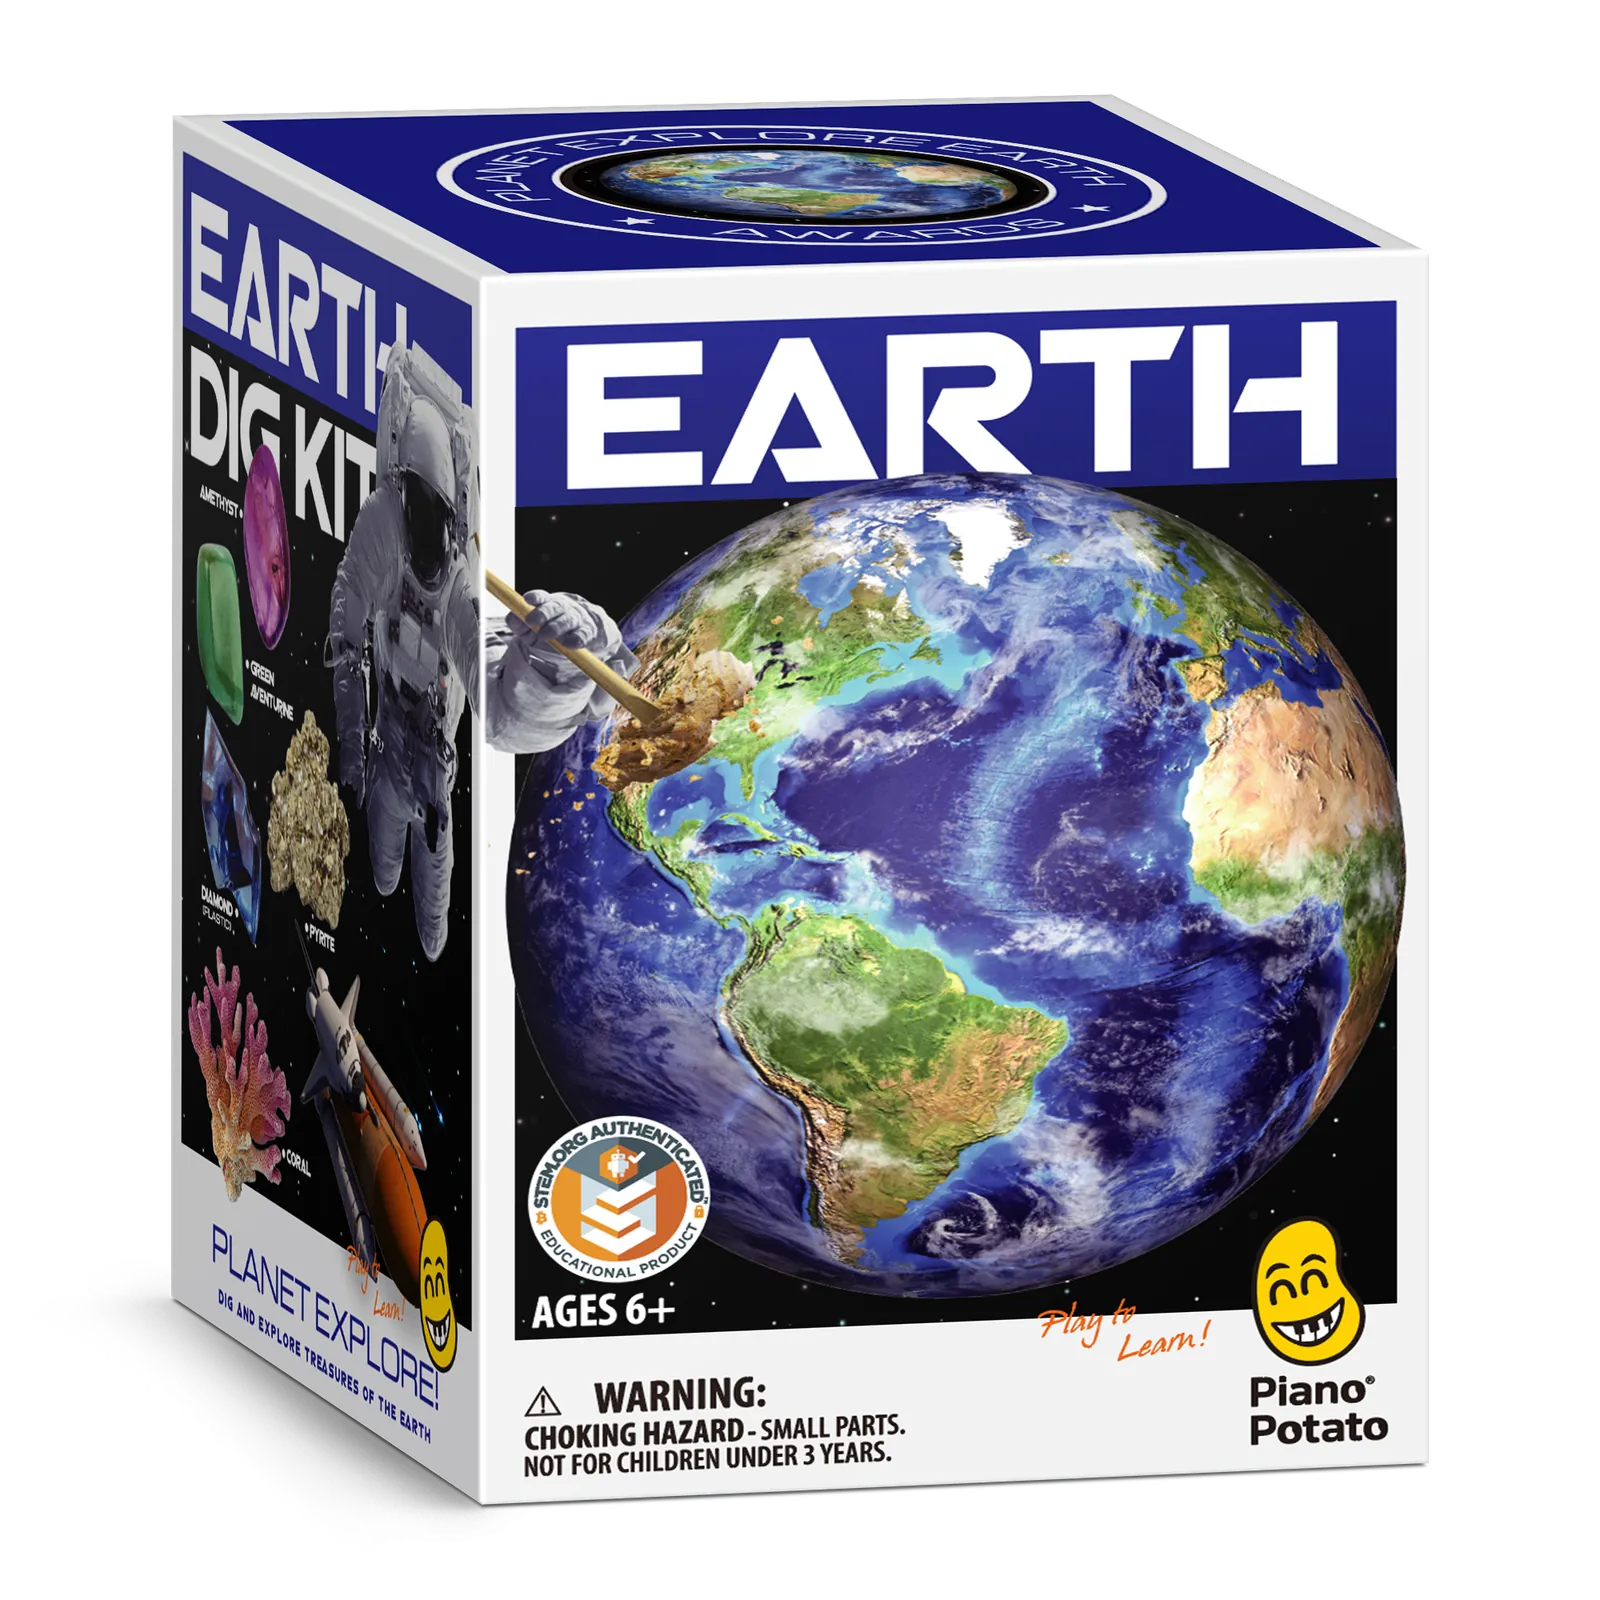
Sugar Dissolving Test
Use the same water volume, sugar mass, container, stirring method, and timing method. Change the water temperature.
The sugar amount should be small enough to dissolve completely at every temperature in the test.
Illustrative example data:
| Water Temperature | Sugar | Example Dissolving Time |
|---|---|---|
| 20°C | 10 g | 94 seconds |
| 40°C | 10 g | 57 seconds |
| 60°C | 10 g | 31 seconds |
The times are examples, not target results. Grain size, water volume, stirring speed, and container shape can all change them.
There are also two different questions here: how fast sugar dissolves and how much sugar can dissolve. They are not the same thing. American Chemical Society data lists sucrose solubility at about 204 g per 100 mL of water at 20°C and about 288 g per 100 mL at 60°C.[5]
Crystal Growth Record
A crystal-growing activity turns the same chemistry topic into a multi-day observation.
Use the quantities, temperature, safety instructions, and growing time supplied with the kit.
| Day | Largest Crystal Width | Visible Clusters | Liquid Level |
|---|---|---|---|
| 1 | |||
| 2 | |||
| 3 | |||
| 5 | |||
| 7 |
A prepared crystal-growing kit can provide the container and measured materials. Its own instructions should be used instead of replacing them with a general recipe.
Solar System Scale Test
Take a globe or planet model and check what is actually to scale.
- Are planet sizes to scale?
- Are distances to scale?
- Does the model use two different scales?
NASA JPL gives a useful comparison: if Earth is represented by a sphere 1 cm wide and planet size and distance use the same scale, Neptune would need to be about two miles from the Sun.[6]
That is why most tabletop Solar System models cannot show both planet diameter and distance correctly with one scale.
For a smaller distance-only activity, use:
10 cm = 1 astronomical unit (AU)
On that model:
- Earth is about 10 cm from the Sun;
- Mars is about 15 cm from the Sun;
- Jupiter is about 52 cm from the Sun;
- Neptune is about 300 cm from the Sun.
Keep this as a distance scale only. Do not also use it for planet diameter.
Rock and Mineral Test
Work with 3–5 specimens at a time. A smaller set makes it easier to compare several properties instead of guessing from color.
| Sample | Luster | Texture | Hardness Note | Magnetic? |
|---|---|---|---|---|
| A | Dull | Fine-grained | No | |
| B | Glassy | Smooth | No | |
| C | Metallic | Granular | Yes |
USGS notes that color alone is not a reliable way to identify most minerals. One mineral can appear in different colors, and different minerals can have similar colors.[7]
A small organized rock and mineral collection is easier to study carefully than a large box of unnamed specimens.
If you need known comparison samples, a 15-specimen rock and mineral set can provide labeled examples. Have the child describe the specimen first, then check the supplied name.
Robot Accuracy Test
Program the robot to travel 100 cm and measure where it actually stops.
Example data:
| Trial | Target | Measured Distance | Error |
|---|---|---|---|
| 1 | 100 cm | 93 cm | -7 cm |
| 2 | 100 cm | 96 cm | -4 cm |
| 3 | 100 cm | 95 cm | -5 cm |
Average distance = (93 + 96 + 95) ÷ 3 = 94.7 cm
Average shortfall = 100 – 94.7 = 5.3 cm
Before changing the program, check practical causes:
- wheel slip;
- floor surface;
- battery level;
- wheel diameter;
- motor differences;
- program settings.
Then set an acceptable range of 95–105 cm and adjust the program until three consecutive trials fall inside that range.
The same approach works for a 90° turn.
Science Notebook
Keep the record short enough that the child spends more time doing science than writing about it.
| Field | What to Record |
|---|---|
| Question | What is being tested? |
| Prediction | What does the child expect? |
| Changed condition | What is different? |
| Kept the same | What stays constant? |
| Data | Measurements or observations |
| Result | What happened? |
| Next test | What should be checked next? |
A younger child can use a drawing plus one measurement or sentence. Older learners can add averages, graphs, differences between trials, and one possible source of error.
Keep what was seen separate from the explanation.
Observation: “The seedling is 14 cm tall and has two pale leaves.”
Explanation: “The light condition may have affected its growth.”
Six-Lesson Toy Car Unit
| Lesson | Task | Record |
|---|---|---|
| Motion | Try different pushes and ramp setups | Draw or describe what changes |
| Ramp Height | Test 10, 20, and 30 cm ramps | Three distances per height |
| Surface Test | Test four surfaces | Average stopping distance |
| Data | Calculate averages | Table or graph |
| Error Check | Repeat an inconsistent result | Old and new measurements |
| Challenge | Make the car stop between 80 and 90 cm | Number of successful trials |
This same sequence can be reused with circuits, magnets, plants, weather, crystals, rocks, or robots: run the basic test, compare results, repeat the measurements, calculate what matters, check unusual data, and finish with a new challenge.
Reusable Science Resources
A small set of flexible materials can cover a large part of a homeschool science program.
| Resource | Possible Uses |
|---|---|
| Ruler + measuring tape | Motion, plants, towers, bridges, crystals |
| Digital scale | Bridge loads, rocks, materials, plant mass |
| Magnifier | Leaves, rocks, fibers, insects, crystals |
| Building set | Bridges, towers, gears, simple machines |
| Toy cars | Motion, friction, ramps, measurement |
| Thermometer | Weather, water, plant environment |
| Microscope | Fibers, crystals, prepared biological slides |
| Low-voltage circuit set | Circuits, switches, conductors, motors |
Before buying another kit, check whether the materials you already have can answer the same question. A resource has more long-term value when children can change the setup, collect different results, and use it again at a harder level.
The same applies to STEM toys used for problem solving. The useful part is the work the child does, not how many lights, buttons, or pieces are on the product.
Safety Limits
Use the product age label and instructions as the first safety check. Piano Potato also provides product safety information for its own products.
| Material | Limit |
|---|---|
| Button or coin batteries | Do not use loose batteries as experiment pieces |
| High-powered magnets | Keep loose magnets away from children |
| Electricity | Use low-voltage educational equipment only |
| Heat | Adult handles boiling water, flames, hot plates, and soldering tools |
| Chemicals | Use only as directed; do not mix unknown household chemicals |
| Sun viewing | Never use ordinary binoculars, telescopes, or improvised filters |
CPSC warns that swallowed button batteries can cause severe internal injury and that serious tissue damage can occur in as little as two hours.[8]
CPSC also warns that swallowed high-powered magnets can attract each other inside the body and cause intestinal blockage, perforation, infection, and other serious injuries.[9]
NASA states that cameras, binoculars, and telescopes used for direct solar viewing require a special-purpose solar filter secured over the front of the optics.[10]
If a button battery or high-powered magnet may have been swallowed, seek immediate professional medical attention rather than waiting for symptoms.
Finally
Good homeschool science does not depend on owning a large number of toys. It depends on getting useful work from the materials already on the table. Three ramp trials give children numbers they can average. A 30 cm bridge can be checked against a 1,000 g load. A seven-day weather record produces a real temperature range and rainfall total. A 100 cm robot target gives a clear way to measure error. A 10-day plant record shows why height alone is not enough to judge growth. Keep the setup controlled when you are comparing one factor, record results that do not fit the pattern instead of hiding them, and end with a task the child has not already practiced. That is where a toy stops being just an activity and starts doing real curriculum work.